Visualize GPS Trajectories with Kepler.gl
Have you ever wanted to visualize a (large) number of GPS trajectories? This is something that I’ve done a lot in the past and over the years I’ve been able to do it in a lot of different ways. Luckily these days there are a lot neat visualization libraries out there that can help you visualize your data. I’m going to show you to use Kepler.gl to visualize your data. Let’s get to it!
We start by importing the libraries we need and load our data.
import pandas as pd
import numpy as np
import json

df = pd.read_feather("trips-2022-03-19-18-30.feather")
Let’s take look at our data. The column id_loc is just a sequential number that we can use to identify the location within a trip.
trip_id is an id that we can use to identify the trip. lat and lon are the latitude and longitude of the location. I’ve rounded the lat and lon to three decimal places just for paranoia’s sake!
df.head()
| id_loc | lat | lon | bearing | speed_kmh | timestamp | trip_id | |
|---|---|---|---|---|---|---|---|
| 0 | 0 | 45.754 | 15.956 | 50.625 | 54.144 | 2021-11-06 14:29:57 | 0 |
| 1 | 1 | 45.754 | 15.956 | 52.031 | 57.816 | 2021-11-06 14:29:58 | 0 |
| 2 | 2 | 45.754 | 15.956 | 53.086 | 59.076 | 2021-11-06 14:29:59 | 0 |
| 3 | 3 | 45.755 | 15.957 | 54.141 | 60.048 | 2021-11-06 14:30:00 | 0 |
| 4 | 4 | 45.755 | 15.957 | 55.547 | 60.048 | 2021-11-06 14:30:01 | 0 |
Sadly I didn’t have too many trips at hand so I decided to manipulate data a bit to make it look like I have more trips that I do! I just shift all the trips to Marth 19th 2021. This might mess up with trips happening over the midnight, but I don’t care much about that. Additionally I convert the datetime to a unix timestamp, which is the time format that Kepler.gl uses.
df["timestamp"] = df.timestamp.apply(lambda x: x.replace(year=2021, month=3, day=19))
df["timestamp"] = df.timestamp.astype(np.int64) // 10**9
Here’s the result:
df.head()
| id_loc | lat | lon | bearing | speed_kmh | timestamp | trip_id | |
|---|---|---|---|---|---|---|---|
| 0 | 0 | 45.754 | 15.956 | 50.625 | 54.144 | 1616164197 | 0 |
| 1 | 1 | 45.754 | 15.956 | 52.031 | 57.816 | 1616164198 | 0 |
| 2 | 2 | 45.754 | 15.956 | 53.086 | 59.076 | 1616164199 | 0 |
| 3 | 3 | 45.755 | 15.957 | 54.141 | 60.048 | 1616164200 | 0 |
| 4 | 4 | 45.755 | 15.957 | 55.547 | 60.048 | 1616164201 | 0 |
We use the Trip layer, which the most suitable and a more recent feature of Kepler. After taking a look at the documentations we notice that the data should be provided in a GeoJSON object however there seems to be plans to add support for other formats in the future.
Next step is to turn our DataFrame into a GeoJSON object. If you want to nerd out and dig deep into the details of GeoJSON formatting, you can check out the GeoJSON specification.
I just use a for loop to manually create the GeoJSON object. Kepler.gl expects coordinates to be in the format [longitude, latitude, altitude, timestamp], sadly I don’t have altitude data so I just put 0 for it.
df["altitude"] = 0

geo_json = dict(type="FeatureCollection", features=[])
geo_json["features"]
for trip in df.trip_id.unique():
    feature = dict(type="Feature", geometry=None, properties=dict(trip_id=str(trip)))
    feature["geometry"] = dict(type="LineString", coordinates=df.loc[df.trip_id==trip, ["lon", "lat", "altitude", "timestamp"]].to_records(index=False).tolist())
    geo_json["features"].append(feature)

geo_json["features"].append(feature)
It’s needles to say that you need to first install the Kepler.gl library. Kepler.gl also works in Jupyter Notebook, complete instruction can be found here. It’s quite handy that you can first display the map in your Jupyter Notebook, manually adjust the configurations using the UI and then export programmatically export the configuration so that the next time you run the notebook you can just load the configuration and it will work. On top of that you can also export the map along with the data as a HTML file.
Here’s how to display the map for the first time:
from keplergl import KeplerGl

my_map = KeplerGl(data={"trip_data": geo_json}, height=600)
my_map
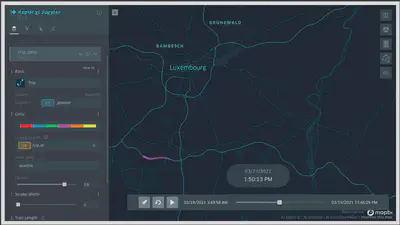
The result would look like something like this:
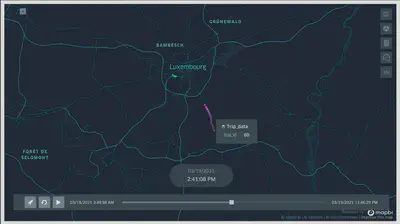
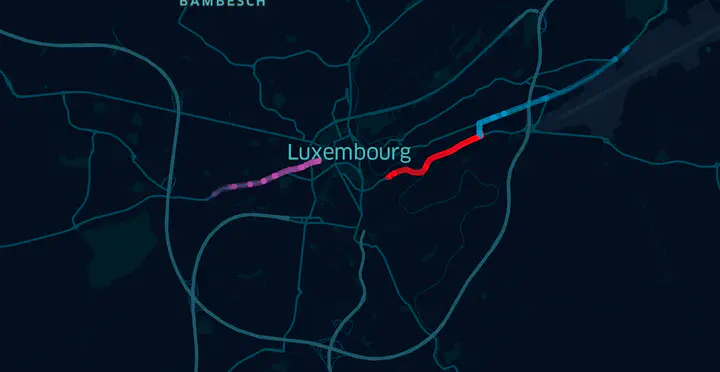
You can use the Play button to animate the map. There are loads of other options to customize the map, but I’m not going to go into that here. Just to give you an idea of what’s possible I configure the map so that it uses a different color for each trip.
After you have the desired configuration, in the next cell you can write:
my_map.config
And executing the cell will spit out all the configuration which you can either save a JSON file or just assign it to a variable that you can next time pass to the Kepler.gl and have it applied to the map in no time.
config = {
    "version": "v1",
    "config": {
        "visState": {
            "filters": [],
            "layers": [
                {
                    "id": "wlh9osp",
                    "type": "trip",
                    "config": {
                        "dataId": "trip_data",
                        "label": "trip_data",
                        "color": [218, 0, 0],
                        "highlightColor": [252, 242, 26, 255],
                        "columns": {"geojson": "_geojson"},
                        "isVisible": True,
                        "visConfig": {
                            "opacity": 0.8,
                            "thickness": 2,
                            "colorRange": {
                                "name": "ColorBrewer Set1-6",
                                "type": "qualitative",
                                "category": "ColorBrewer",
                                "colors": [
                                    "#e41a1c",
                                    "#377eb8",
                                    "#4daf4a",
                                    "#984ea3",
                                    "#ff7f00",
                                    "#ffff33",
                                ],
                            },
                            "trailLength": 250,
                            "sizeRange": [0, 10],
                        },
                        "hidden": False,
                        "textLabel": [
                            {
                                "field": None,
                                "color": [255, 255, 255],
                                "size": 18,
                                "offset": [0, 0],
                                "anchor": "start",
                                "alignment": "center",
                            }
                        ],
                    },
                    "visualChannels": {
                        "colorField": {"name": "trip_id", "type": "integer"},
                        "colorScale": "quantile",
                        "sizeField": None,
                        "sizeScale": "linear",
                    },
                }
            ],
            "interactionConfig": {
                "tooltip": {
                    "fieldsToShow": {
                        "trip_data": [{"name": "trip_id", "format": None}]
                    },
                    "compareMode": False,
                    "compareType": "absolute",
                    "enabled": True,
                },
                "brush": {"size": 0.5, "enabled": False},
                "geocoder": {"enabled": False},
                "coordinate": {"enabled": False},
            },
            "layerBlending": "normal",
            "splitMaps": [],
            "animationConfig": {"currentTime": 1616174376576.6997, "speed": 1},
        },
        "mapState": {
            "bearing": 0,
            "dragRotate": False,
            "latitude": 49.555586010427305,
            "longitude": 6.153559360201813,
            "pitch": 0,
            "zoom": 10,
            "isSplit": False,
        },
        "mapStyle": {
            "styleType": "dark",
            "topLayerGroups": {},
            "visibleLayerGroups": {
                "label": True,
                "road": True,
                "border": False,
                "building": True,
                "water": True,
                "land": True,
                "3d building": False,
            },
            "threeDBuildingColor": [
                9.665468314072013,
                17.18305478057247,
                31.1442867897876,
            ],
            "mapStyles": {},
        },
    },
}
Here’s how you would initialize the map next time:
my_map = KeplerGl(data={"trip_data": geo_json}, config=config, height=600)
my_map
Now that you built your beautiful map, you can export it as a HTML file, setting read_only to True will make it so that you can’t edit the map.
my_map.save_to_html(file_name="map.html", read_only=True)
Map saved to map.html!
Thanks for reading!