Plot GPS Trajectories using Matplotlib
One of my favorite Python map libraries is Folium, it allows you to create interactive maps using leaflet.js. However interactivity which is its main feature is also its greatest disadvantage, it does not allow you to easily export the resulting map as static image. A couple days ago I had to overlay a car trip on the map and I stumpled upon this neat library called TileMapBase. Here’s how it works, first we import the necessary libraries:
import pandas as pd
import matplotlib.pyplot as plt
import tilemapbase
I have feather file which contains several trips, I load the file and pick of trip to plot.
df = pd.read_feather('trips.feather')
trip_id = 63
trip_df = df[df.trip_id == trip_id][["lon", "lat"]]
The first time you use the library, you have to call the init function to initialize the database.
tilemapbase.init(create=True)
Just to demonstrate the value of basemaps, let’s take a look at the trip without the basemap!
plt.plot(trip.lon, trip.lat)
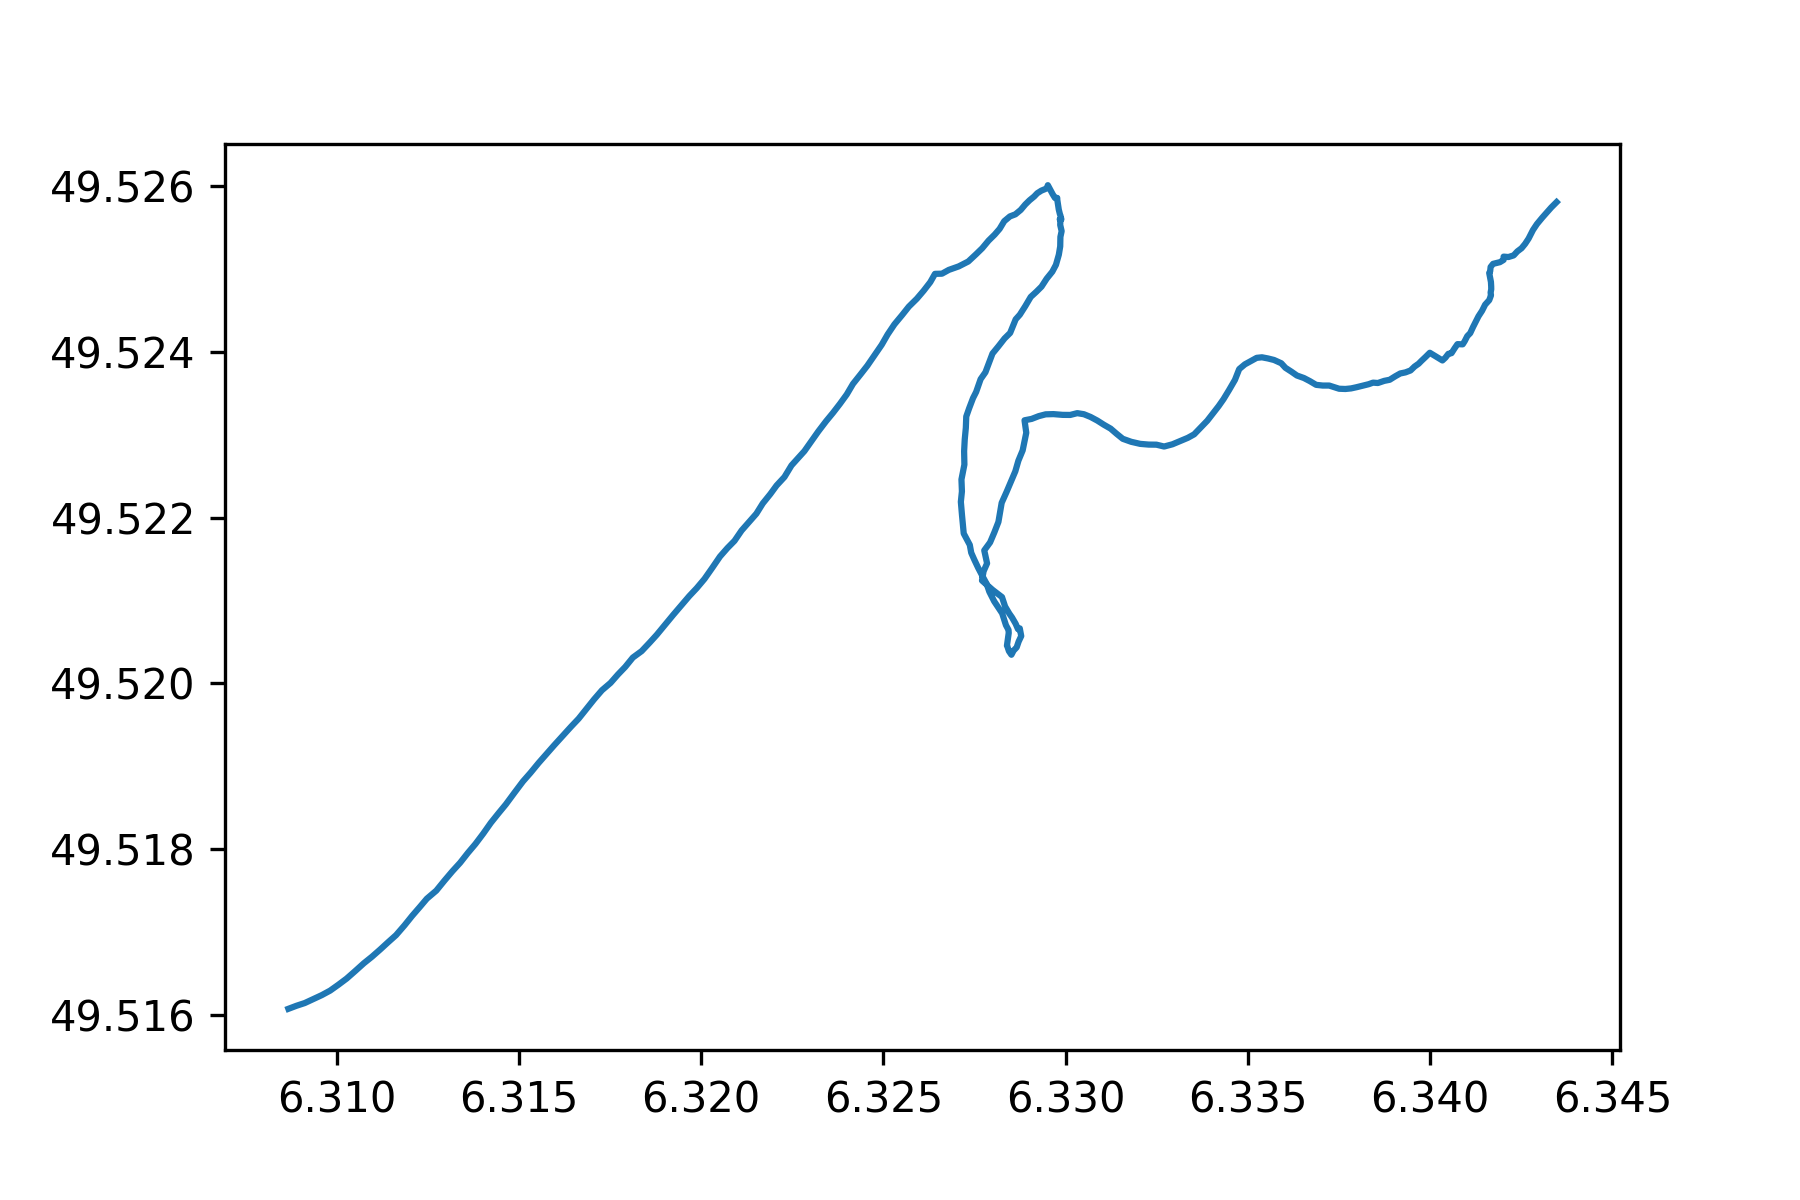
Now that we established this is not we want! let’s add the basemap! First we calculate the extent of the image, which the bounding box of the trip + some margin.
expand=0.002
extent = tilemapbase.Extent.from_lonlat(
    trip_df.lon.min() - expand,
    trip_df.lon.max() + expand,
    trip_df.lat.min() - expand,
    trip_df.lat.max() + expand,
)
Next we project the trip data to “Web Mercator” projection, normalised to be in the range [0,1].
trip_projected = trip_df.apply(
    lambda x: tilemapbase.project(x.lon, x.lat), axis=1
).apply(pd.Series)
trip_projected.columns = ["x", "y"]
Next we choose the OSM titles for the basemap. There are other options to pick from, such as Stamen or Carto. Check TileMapBase for more.
tiles = tilemapbase.tiles.build_OSM()
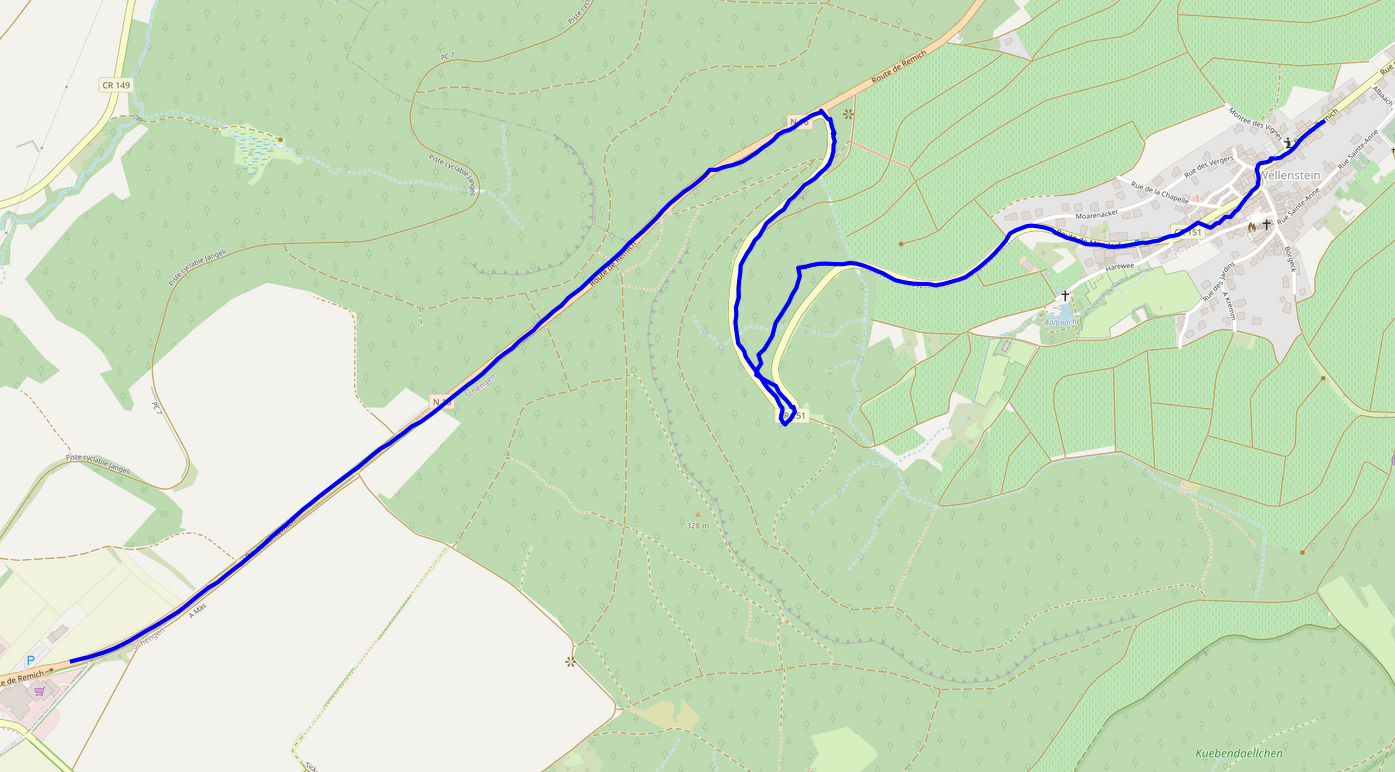
Lastly, we plot the map and the trip using Matplotlib, which we can easily export as PNG.
fig, ax = plt.subplots(figsize=(8, 8), dpi=300)
ax.xaxis.set_visible(False)
ax.yaxis.set_visible(False)
plotter = tilemapbase.Plotter(extent, tiles, height=600)
plotter.plot(ax, tiles, alpha=0.8)
ax.plot(trip_projected.x, trip_projected.y, color='blue', linewidth=1)
plt.axis('off')
fig.savefig('trip.png', bbox_inches='tight',pad_inches=0, dpi=300)